- The Moneycessity Newsletter
- Posts
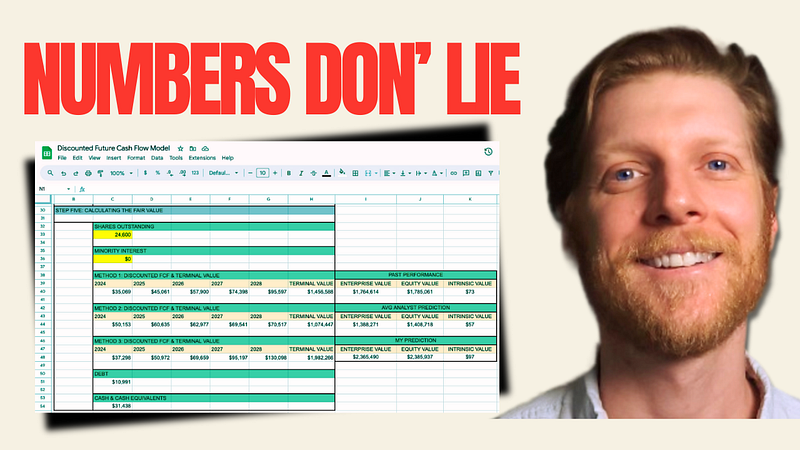
- How To Know If a Stock is OVERVALUED
How To Know If a Stock is OVERVALUED
Wondering if a stock is overvalued? Learn to use the discounted cash flow (DCF) model to assess a company's intrinsic value. Follow my step-by-step guide to create your own valuation spreadsheet in Excel, or download my pre-made one for FREE!
Brian Glass
July 26, 2024
How can I tell if a stock is overvalued in the past?
In the past, I would simply compare the current share price to the current earnings of a company, but that doesn’t really paint the full picture.
If there is real growth on the horizon for a company, then maybe it makes sense for me to pay a slightly higher price. Conversely, if a company is in real trouble, I probably want to stay away despite a discounted share price.
By knowing the difference between these two scenarios, I’ll be able to accelerate my returns much faster and achieve financial independence decades sooner.
Even though there is no crystal ball method, unless you’re a politician or something, there are several ways that you can approximate the intrinsic value of a company.
I’m going to go over my favorite way, how it works, how to make it in Excel.
And then of course, if you want to just use mine instead of building your own, you can download it for free HERE.
On the go? Watch the video HERE.
How to Calculate Intrinsic Value from Discounted Future Free Cashflow Model
What does it mean to “Return Value”?
There are only two ways that buying a company’s stock will make me money.
The stock pays me cash commonly in the form of a dividend.
I sell that stock for more than what I bought it for.
When I look at a company’s financials, not only do I want to see the revenue growing, but I also want to see them spending more and more of that revenue on things like dividends, reinvesting in the company, or paying off debt.
I want to see them spending that revenue on ME or things that will make more revenue. If a company can’t do that, then a growing revenue stream doesn’t really mean much to me, the investor.
Money spent on growth might look like research and development, expanding into additional markets, employee development, marketing, improving your customer experience, etc. That’s the chunk of money that I really want to analyze.
What is the Discounted Future Free Cashflow Model?
When I buy a single share of stock, what percentage of that share price is being spent on operating expenses, administration expenses, and interest on debt versus what chunk of that share price is actually being spent on growth in dividends?
The higher the percentage spent on growth, the better for me. That is the margin that I want to see grow higher.
The best single financial metric that represents this chunk of money is called not profit, free cashflow. The reason profit doesn’t work is because a company’s profits are reduced by non-cash expenses.
On paper, they’re able to deduct things like depreciation, amortization, unrealized gains, losses, etc.
These are all non-cash expenses, and they don’t actually reduce the amount of cash that a company has on hand to invest in growth or return value to shareholders.
How Does the Discounted Future Free Cashflow Model Work?
The discounted future free cash flow model works on the premise that money received right now is worth more than money received later.
If I receive $100 today, I can make interest on that money and it might be worth $105 next year. By that logic, receiving $100 today is roughly the same as receiving $105 next year.

Let me give a quick example.
I have a food truck that I expect will make money for the next three years. Here’s how you might use the discounted cash flow model to figure out what my food truck is worth today:
1. Estimate future cash flows:
— Year 1: $100
— Year 2: $120
— Year 3: $150
2. Choose a discount rate: 10%
This represents the risk that I might not receive the money that I think I will, and it represents the time value of money.
3. Calculate the present value of each year’s cash flow:
— Year 1: $100 / (1 + 0.10)¹ = $90.91
— Year 2: $120 / (1 + 0.10)² = $99.17
— Year 3: $150 / (1 + 0.10)³ = $112.70
4. Sum up the present values:
$90.91 + $99.17 + $112.70 = $302.78
So, according to the discounted cash flow model, my food truck is worth about $302 today even though the sum of the real cash flows is $370.
This method takes into account that:
Money in the future is worth less than money today.
There’s some risk involved in future earnings.
The total value is based on the cash the business is expected to generate.
Remember, this is a simplified example. In real-world scenarios, businesses often use more complex calculations and consider many more factors but the basic principle remains the same.
So let’s get into the real spreadsheet where we analyze the real businesses.
There are five steps to calculate the intrinsic value of a company on my discounted future free cashflow spreadsheet.
Step 1: Determine Future Free Cashflows
The first step is to determine the next five years of free cash flow for a company. There are three ways that I go about doing this.
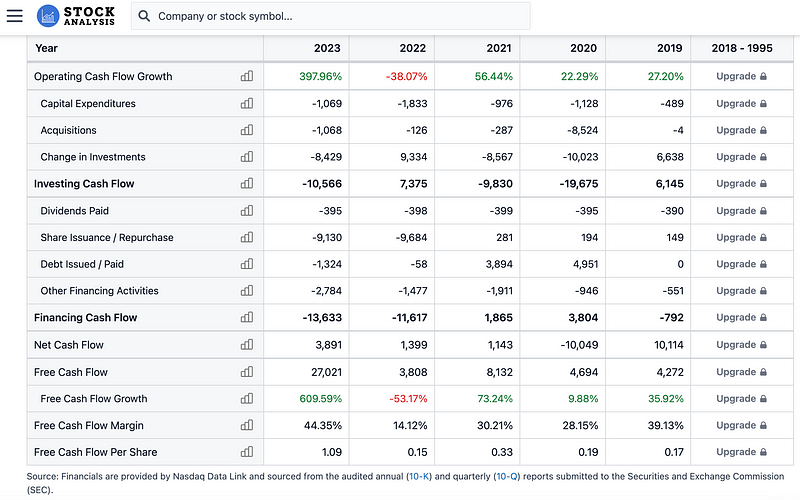
Use Past Performance
I can look at past performance by pulling up the cashflow statement of the financial documents of a company. Whatever the growth was in free cashflow for the previous five years, I can extrapolate that same growth for the next five years.
Now, this strategy will not work well if a company is undergoing major changes, it will only work for very mature and constant growth companies.
For instance, NVIDIA had massive revenue growth last year due to selling tons of chips for data centers. This growth may or may not be sustained so it’s hard to say if a 46% revenue growth is going to be consistent year over year for the next five years.
So maybe for NVIDIA, I would not use past performance.
Use Analyst Projections
Unfortunately, analysts do not typically make free cash flow predictions. However, they do make revenue predictions. So I can combine the revenue projection with the past performance of the free cash flow margin.

The free cash flow margin is the percentage of revenue that is free cash flow. I can apply the average margin over the last five years to the analyst’s future revenue predictions and indirectly get an analyst projected free cash flow growth over the next five years.
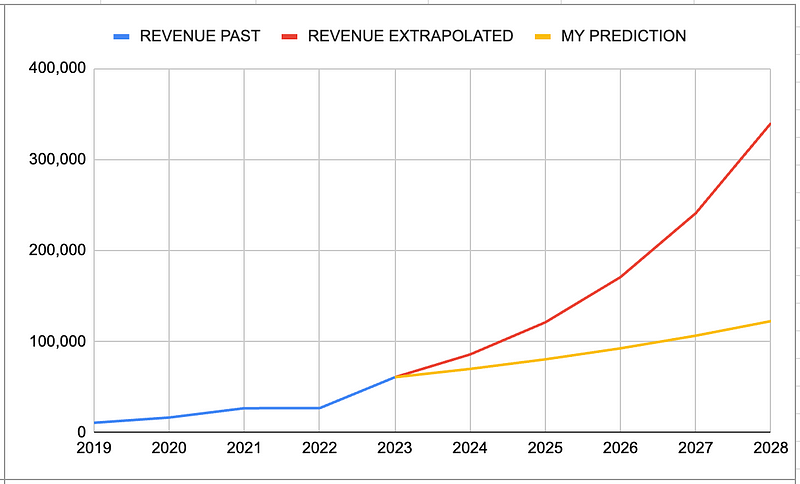
Use Personal Projections
This is more of an exploratory projection.
I will choose different growth trajectories to see how much growth is required to justify the current share price.
Over the last five years, NVIDIA had a free cash flow growth of 44.6%. I might want to see what stock price will result if their free cash flow growth is only 15%, or maybe if it’s 50% year over year. I can use this to see what stock prices make sense in different scenarios.
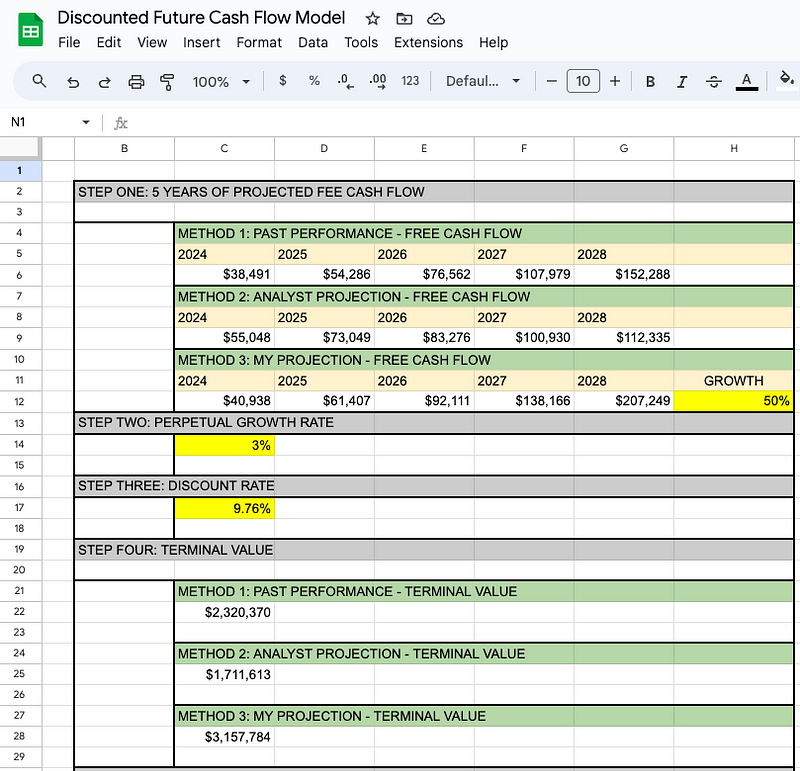
Below is a screenshot of my spreadsheet showing three different methods for projecting NVIDIA’s future free cash flow.
Step 2: Determine the Perpetual Growth Rate
The second step is to determine the perpetual growth rate of the company you are analyzing.
Perpetual growth rate is the rate of growth for that company going into infinity, which is roughly equal to the rate of inflation.

We can’t select a perpetual growth rate higher than inflation because it wouldn’t make sense for our company to grow faster than the whole economy forever. After all, the economy would eventually be dwarfed by one company.
Step 3: Determine the Discount Rate
The discount rate is the return that you would expect to receive over time.
This takes into account the time value of money, as well as the risk level of the particular investment that you are in.
There are many ways to come up with this number. One popular method is to use the weighted average cost of capital which is the average rate that a business pays to finance its assets.

I like to use this figure because it’s easy to look it up.
If I’m using NVIDIA, I can just type in “NVDA WACC” into Google, which is about 10% in this case.
Otherwise, you can pick a discount rate that matches your individual risk profile. You might be fine with a 7% discount if you do not perceive as much risk with a given company.
Step 4: Determine the Terminal Value
The terminal value refers to all of the future free cash flow after our projection period.
You might have been wondering why we only projected five years out. Is this company just going to disappear after five years?
Well, no. It’s just that trying to project exact cash flows after five years gets really difficult. There’s just no way to be accurate after five years.
So from six years and on, we’re just going to go with the terminal value which assumes:
Perpetual growth rate which is constant annual growth of 3%.
The discount rate of 9.76% gives the value of all future cash flows after year five.
The spreadsheet automatically calculates the terminal value as long as:
The next five years of free cash flow are entered
The perpetual growth rate is entered
The discount rate is entered.

In the spreadsheet, I have calculated three different terminal values because all three methods for estimating the next five years of free cash flow produce different results.
In the equation for terminal value (TV) above, the free cash flow predicted for the year 2028 is used for all three projections.
Step 5: Calculate the Fair Value of the Company
If you are using my spreadsheet, most of the information is automatically scraped from the web when you input the ticker of the company you want to analyze. However, there are still a couple of numbers that I have to manually enter.
Number of shares outstanding
Minority interest in the company
Both of these can be found using Google and will come into play later.

The next step is to apply the discounted cash flow formula (shown below) to each of the predicted cash flows in step one.
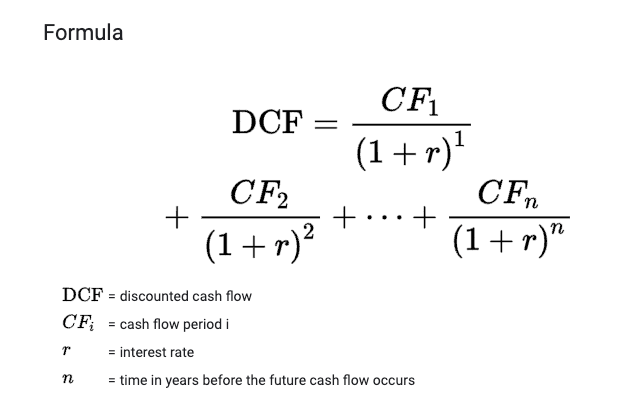
In this equation, “DCF” is the sum of all discounted future cash flows. “CF1” represents the predicted cash flow from 2024, “CF2” represents 2025, and so on. The “r” represents our discount rate (and the exponent “n” represents the time in years.
Below, the screenshot of step five shows the discounted cashflows for all five years and the discounted terminal value.
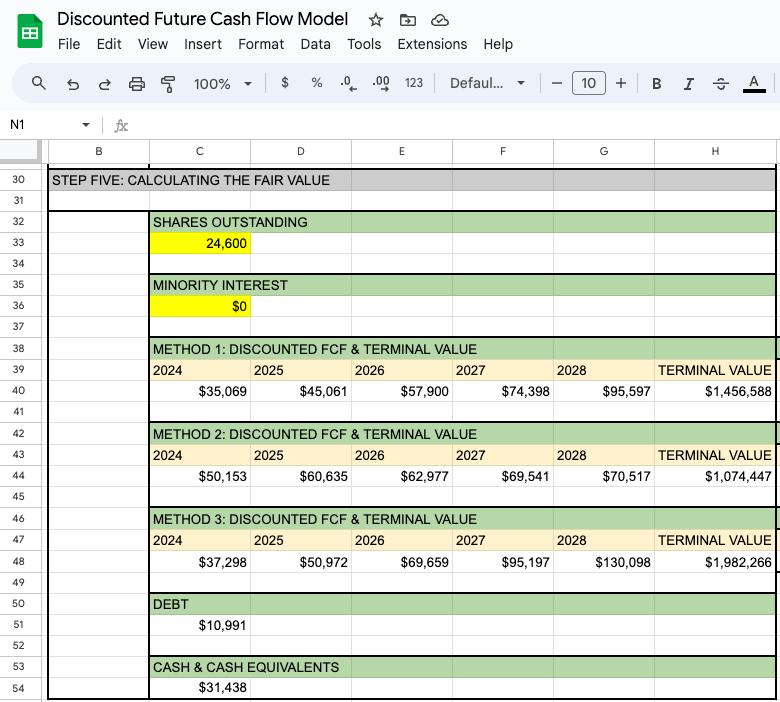
Method 1 Example: Calculate All Discounted Free Cash Flows
To calculate the discounted cash flow for 2024, the following equation is used:
— $35,069 = $38,491 / (1 + 0.0976) ^ 1
To calculate the discounted cash flow for 2025, the following equation is used:
— $45,061 = $54,286 / (1 + 0.0976) ^ 2
To calculate the discounted terminal value, the following equation is used:
— $1,456,588 = $2,320,370 / (1 + 0.0976) ^ 5
After calculating the discounted cash flows of 2024 through 2028 and the discounted terminal value, we can determine the enterprise value of NVIDIA which is the sum of ALL discounted future free cash flows.

In this case, this whole row in method 1 summed together equals $1,764,614. Now remember, these numbers are reduced by a million. So in this case, it’s actually $1.764 trillion.
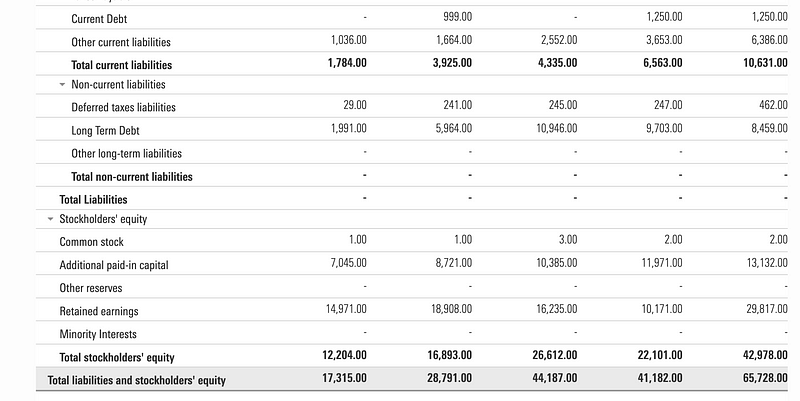
Now this isn’t NVIDIA’s total value that we want to calculate.
NVIDIA still has cash and cash equivalents on hand that count for them. So we want to add $31,438 to this value. And then we also want to subtract out their current debt which is $10,991. Finally, we want to subtract NVIDIA’s current minority interest which is $0.
After completing these final operations, we have determined the equity value of NVIDIA is $1,785,000 or $1.785 trillion.
And now the only thing left is to divide that equity value by the number of shares outstanding, which is also in millions, and we get our intrinsic value for NVIDIA using the past performance.
If all of our assumptions are correct, then the intrinsic value of NVIDIA is $73 per share.
So What Now?
Please remember that the intrinsic value calculated by this model is built on big assumptions, namely the projected future free cash flow:
Projections used in this video could be drastically improved — this was just to illustrate the method.
Companies undergo massive changes from time to time that are impossible to anticipate. And when that happens, previous projections should be thrown out the window.
I like to use a margin of safety before I go out and buy a stock based on the prediction of the model. I will use a margin of safety anywhere between 10% and 25% depending on my perceived level of risk with that investment or the volatility of that stock.
If the model says $100 per share, I might only buy it for $75. That way my downside is limited. As for unexpected changes, the best I can do is update my projections as soon as new information comes out.
That is why I took the extra time to automate my spreadsheet. If I had to manually enter all the financials every quarter every time a major change occurred within a company, I would just not do it.
So if you’re interested in quickly evaluating the intrinsic value of companies, please feel free to DOWNLOAD my FREE spreadsheet.
However, you will not be able to evaluate ETFs. If you’re interested in my method to evaluate ETFs that outperform the S&P 500, check out this video right HERE.
Catch on the flip side.
Reply