- The Moneycessity Newsletter
- Posts
- How To MAKE MONEY on Your First Home
How To MAKE MONEY on Your First Home
How to make money off my house? If you made the same mistake and bought a house as your primary residence solely because you thought it would be a good investment like me and Natalie, you’ve come to the right video. We will compare the yearly costs of owning a house to renting an apartment in a 10-year projection and discuss 3 methods to reduce expenses and make money without leaving the house
Brian Glass
February 29, 2024
So you’ve bought a house because it’s been driven into your brain that renting is like throwing away money.
Maybe you bought a house when you really didn’t need the space.
Maybe you’re like me and Natalie. We liked the idea of building equity, but we didn’t truly understand all of the costs of home ownership until we did it for a few years.
If you made the same mistake and bought a house as your primary residence solely because you thought it would be a good investment, do not worry.
Previously, I went over all the scenarios where renting is superior, but now I’m looking at the paths of ownership that lead to greater profit.
On the go? Watch my video HERE.
Let’s get into it.
Power of Leverage in Real Estate
One of the key concepts that gives real estate is power is leverage.
Let’s say I put $10,000 down on a $100,000 house which means I have a loan of $90,000.
If that house immediately goes up by 5% and is now worth $105,000, then I’m profiting by $5,000.
Hypothetically, if I was able to immediately sell that house without paying closing costs, then I could return the $90,000 that I borrowed and be left with $15,000.
Since I only put $10,000 down initially, that’s a profit of 50% even though the house only appreciated by 5%.
When you put 10% down on that $100,000 house, your loan is 9X the value of your down payment. You cannot get that kind of leverage investing in stocks without the risk of a margin call.
The only problem with that crazy leverage is that it comes at a high price.
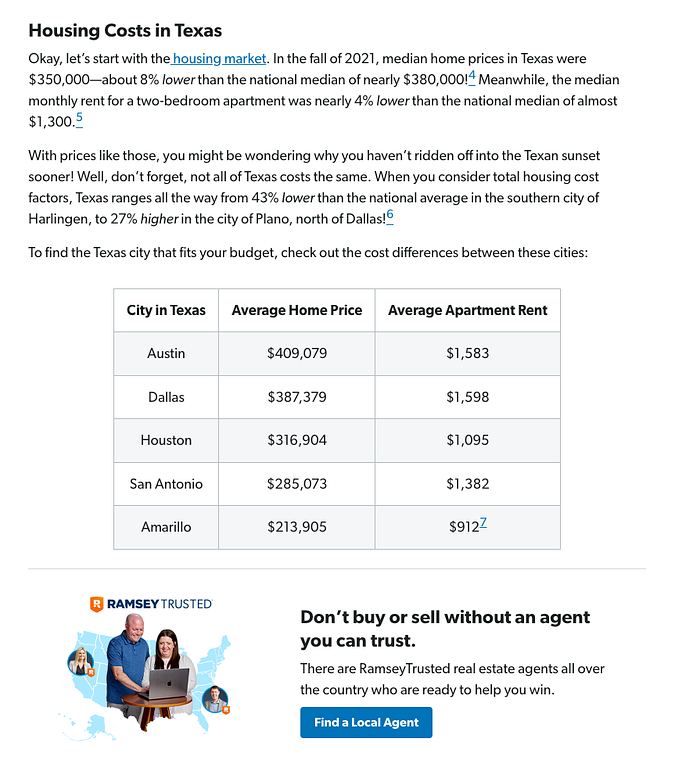
Average Home Price VS Average Apartment Rent
Here is the yearly cost breakdown of the average house in Texas worth $214,000 with today’s interest rate of 6.6% and a down payment of 3.5%.
These are all sunk costs so none of the homeownership expenses are going towards your equity. These are all things that you’re losing and you’re never getting it back, and thus cannot be counted as an investment.

Renting VS Buying a House Illustration by author
In a year, you’re spending $13,470 on interest, $3,585 on property tax, $2,400 on homeowners insurance, and $346 on maintenance.
This is using the 1% rule. In general, you should put aside 1% of the value of your home towards maintenance. Some years you may not spend very much on maintenance, but other years you might have to spend a lot. This is just averaged out over a long period of time.
You’re also spending $1,549 in mortgage insurance.
This is because we only put 3.5% down on this house. If you put 20% down on the home, you can avoid mortgage insurance but this can be really hard to do.
Finally, we have about $600 per year in HOA fees.
In total, you’re spending about $4,000 more per year if you own a house with these specifications than if you rent a modest apartment at about $1,600 per month.
Is Home Ownership Really Better than Renting?
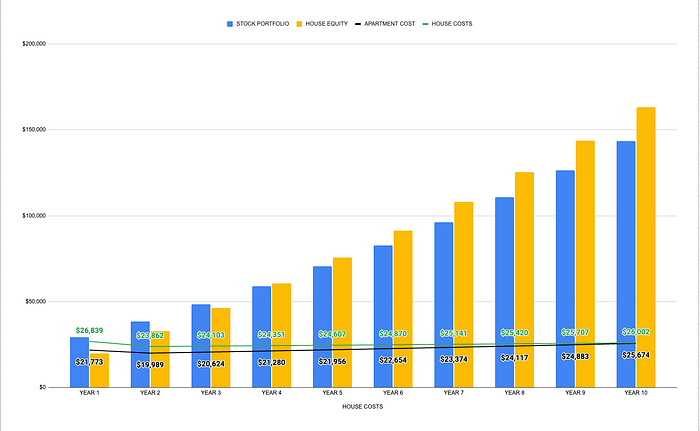
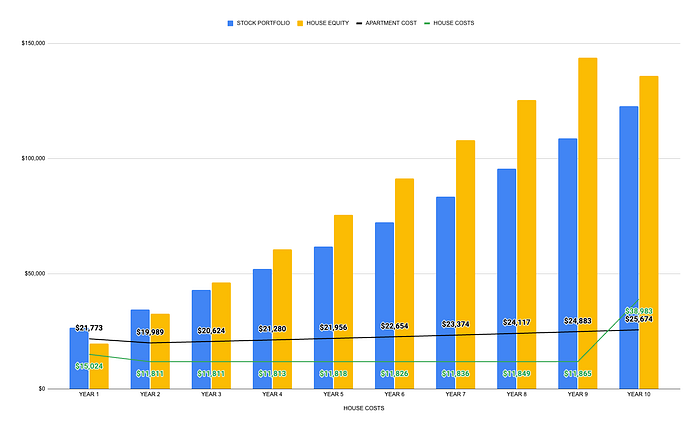
Next, we’re going to look at a 10 year projection so we can kind of get an idea of how greater expenses is going to play out over the course of owning the house.
We’ve got 4 data series in this graph.
The yellow bars is your house equity over time.
The green line is your housing expenses each year.
The black line is your apartment expenses each year if you rent a $1,600 apartment.
The blue bars is your portfolio equity. Instead of owning a house and paying the higher expenses, you can invest the difference in a portfolio of stocks, for example the S&P 500. The blue bar is how much you could expect that portfolio to have at the end of each year.
Renting VS Buying a House Illustration by author
The cost of owning a house is greater than the cost of renting an apartment up until year 10.
In the first 3 years, the stock portfolio has a greater value than the equity in your house. However, because of the increased leverage, the house equity is able to outpace the portfolio value.
This is a little bit misleading though, because if you sold your house on year 10, you would lose a huge chunk of your profits to closing costs.
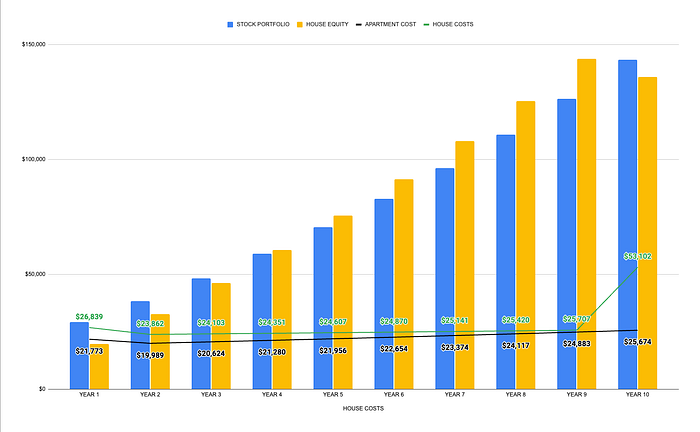
In Texas, closing costs range from 6% to 10% of the selling value. After we factor in an average of 8% closing cost, you can see the portfolio of stocks comes out on top and the cost of homeownership skyrockets in year 10.
How I Reduce Home Ownership Expenses
With expenses being so high, the benefit of the high leverage is canceled out.
So the plan is simple: Reduce Expenses.
There are 3 ways you can make this happen, and I have done the math on each one. They are all pretty simple and straightforward, but seeing the numbers play out over time is pretty wild.
If you need a house because you have a large family or some other lifestyle requirement, then your house is not an investment. It’s a necessary living expense. If that’s the case, some of these methods might not make sense for you.
However, this first method will work for any homeowner.
Method 1
After owning a home for 3 to 4 years, there are 2 major changes that will probably take place.
Your home will probably appreciate a little bit every year.
Your interest rates will probably change.
If interest rates have dropped even a little bit and your home has experienced just average appreciation, then refinancing can save you so much money.
Typically with a 3.5% down payment, it will take you approximately 10 years to pay off your loan enough to drop your mortgage insurance payment once you have paid of 20% of your house value.
However, if your house appreciates a bit each year, then you can reach 20% of your house’s current value much sooner.
When you couple reduced interest rates with dropping your mortgage insurance, you can reduce your homeowner expenses by 20%.
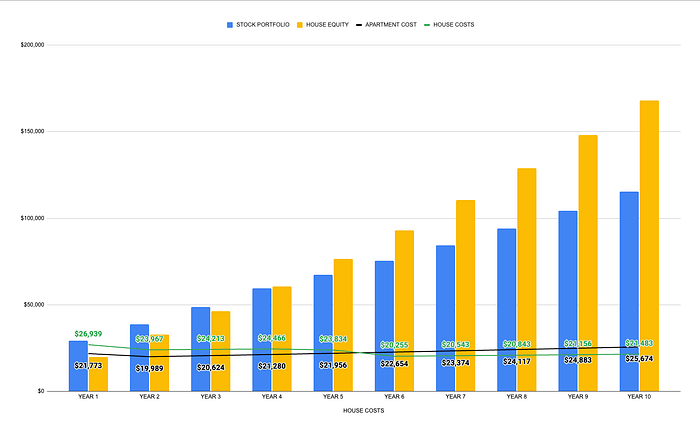
Renting VS Buying a House Illustration by author
This graph projects how much your housing expenses will drop after 4 years when you refinance with a 5% interest rate instead of 6.5% and losing your mortgage insurance.
In year 5, the expenses do not drop as much as you would think because it does cost money to refinance your house. On average, it costs about 2% of the new loan amount. On the $214,000 house, this ends up being roughly $4,000 in expenses.
However, you make that up and then some after just 2 years.
In year 6, your yearly homeowner expense of $24,466 from year 4 drops all the way down to $20,255.
In this example, you can also see that your home equity is outpacing your stock portfolio by more and more.

Renting VS Buying a House Illustration by author
This time, after factoring in the closing costs after selling your house on year 10, the equity in your house has still outpaced what your portfolio would be at.
Method 2
The second method of reducing your expenses is incredibly simple, but also incredibly underestimated.
For these comparisons, however much money is required to pay the mortgage and expenses of homeownership, that same amount of money is used to pay for apartment expenses and invest in a stock portfolio. That way I can get a comparison apples to apples to answer which scenario is the more effective investment.
If you don’t mind picking up a roommate, you can easily reduce your yearly expenses by 50% or probably more. It would cost your roommate just under $1,000 per month to pick up half of your sunk cost expenses, which is below the market rate.
By reducing the housing expenses by half, you can see that the house equity quickly outpaces the portfolio value.
Renting VS Buying a House Illustration by author
However, after factoring in the 8% closing cost in year 10, the home equity still comes out on top.
Method 3
The third method is to go all the way.
Commit to your house being a pure investment. Get out of there, rent it out and go back to living in an apartment. With the insane amount of leverage available, you do not even need positive cash flow for your home investment to far outpace your stock portfolio.
With a rental property, the biggest deal breaker for most people is the extra work required dealing with tenants.
For this analysis, I’m factoring in the additional cost of a rental property manager which is on average about 10% of your rent premium. Additionally, I have factored in a 20% increase to the cost of insurance and a 9% cost for vacancy, which is about average in Texas.
Renting VS Buying a House Illustration by author
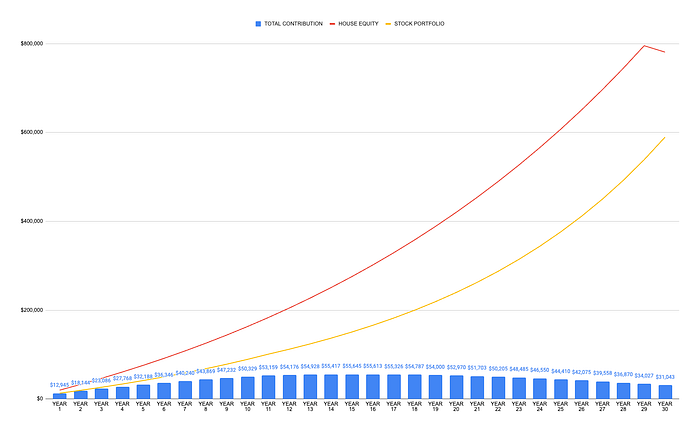
Assuming you’re able to rent your house out for $2,125 per month:
The red line represents your house equity over 30 years of paying off your mortgage.
The yellow line represents how much your stock portfolio would be worth over the same time period had you invested in an S&P 500 index fund.
The blue bars represent your total exposure to this investment over the same time period.
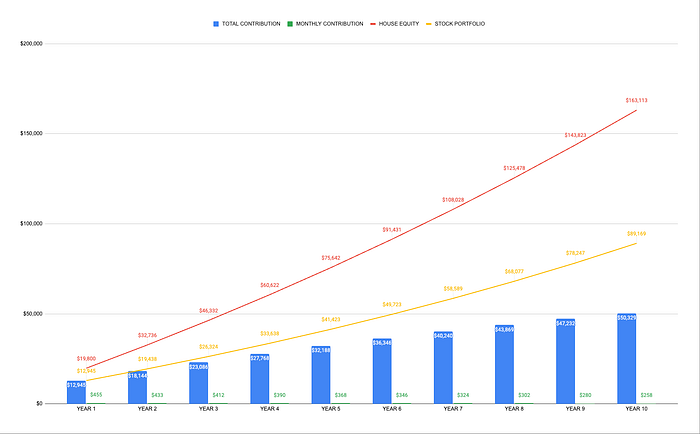
If you moved out of your house today and had a tenant, this graph represents how that investment would perform over a 10 year period.
Renting VS Buying a House Illustration by author
In this graph, we are not looking at the comparison of housing expenses versus apartment expenses anymore.
We are looking at your house rental purely as an investment:
How much money is required to go into that investment
How that amount of money would perform in an S&P 500 index fund
In this example, the amount of rent paid is not enough to have a positive cash flow.
The green column shows how much money you still have to put towards the mortgage and expenses every month. Despite the fact that you’re not cash flowing, this graph will show how well a rental property can do in terms of equity over time.
The blue column shows the total amount of money that you’ve put into the rental property at that time. As an example, in year 1, you will have put about $13,000 into your rental. By year 3, you will have put a total of $23,000 into your rental.
The red line represents how much equity you have in that rental. For instance, in year 4, you’ve put a total of $27,768 into that house. But if you were going to sell it, you could sell it for $60,622 not including closing costs.
The yellow line shows your portfolio value if you did not invest in a rental at all and you instead put all of that money into the S&P 500. In year 1, if you instead put that into the S&P, then you’d have $12,945. In year 2, you would experience some appreciation in your stock portfolio. Even though you’ve put $18,144 into your portfolio in the past 2 years, your portfolio would have appreciated up to $19,438.
Despite the fact that the S&P 500 appreciates on average 10% per year and your house only appreciates 5% per year, the amount of equity that you have in your house is increasing far faster because of the high leverage.
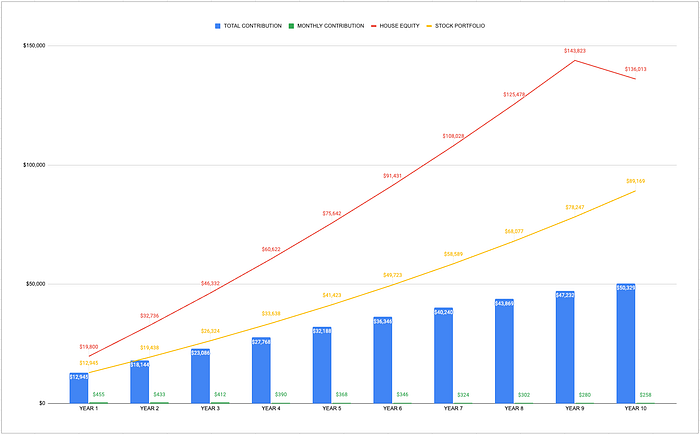
Renting VS Buying a House Illustration by author
Even after factoring in the 8% closing costs if we sell our house at year 10, you’ve gained roughly $50,000 more than if you invested in an S&P 500 index fund.
Remember, thee projections shown here are based on average performance. In reality, you could have years of zero vacancy in dream tenants, or your very first tenant could be a nightmare.
If you would rather avoid the potential headache and invest passively, check out this video HERE where I look at the scenarios where renting an apartment and investing in a stock portfolio destroys owning a home.
And there are more scenarios than you might think.
Catch you on the flip side.
Reply