- The Moneycessity Newsletter
- Posts
- How to Start DIVIDEND GROWTH Investing for Beginners
How to Start DIVIDEND GROWTH Investing for Beginners
I'm going to take a deep dive in the dividend growth investing strategy by analyzing 3 characteristics of superior dividend companies. After exhaustive research, I found 4 criteria that any dividend growth ETFs should have in order to outperform the S&P 500.
Brian Glass
March 10, 2024
You’ve probably heard again and again that the S&P 500 is the gold standard when it comes to reliable investing returns.
But is it really?
The S&P 500 just grabs the 500 biggest companies. In the last year, 150 of these companies over-performed the average while 350 underperformed.
In this issue, we are trying to answer 4 questions:
What if there was a way to hone in on the top performing companies?
Are there ETFs out there that have a way of filtering out some of the under-performers and they just have a greater percentage of the top performers and just a few less under-performers?
Why a dividend growth investing strategy filters for high quality companies ?
How to evaluate the best ETFs.
On the go? Watch the video HERE.
Why Dividend Growth Characteristics Filture for Great Companies?
But before we dive in, let me first explain why dividend growth characteristics filter for great companies.
If I want market returns, I can easily achieve this by buying every company in the market. If I want superior returns, then I have to find a way to invest in superior companies.
There are 3 ways that I can filter out companies from the market to achieve greater returns.
I love blueberries. Let me use blueberries as an example. The smaller blueberries are typically packed with more flavor.
Stock Picking
One way that I could ensure that I only eat the tastiest blueberries is I could pick them out, one by one, by hand.
This is like picking stocks.

Individual Stock Picking Illustration by author
I can evaluate companies based on qualitative metrics. I might really like their product. I might think they have really good customer service. I can analyze companies based on quantitative metrics. I can look at their financial statements to see if their revenues are growing compared to their expenses. How is their debts?
This takes a lot of expertise and it takes a lot of time. I don’t want to spend a lot of time. Picking hundreds of companies.
Actively Managed Funds
The second way that we can ensure that we only eat the tastiest blueberries is by paying somebody else to pick them for us.
This is analogous to an actively managed fund.

Actively Managed Funds Illustration by Author
An actively managed fund employs a team of professionals that have the expertise hopefully to select companies that are of a higher quality. However, it’s very hard to differentiate between an actively managed fund that got lucky one year versus an actively managed fund that is truly skilled.
According to this article by Forbes, it found that over the course of one year, roughly 51% of actively managed funds underperformed the S&P 500.
That’s just barely worse than a coin toss.
This gets much worse when we look at the performance over extended periods of time.
Over 5 years, just 13.5% of actively managed funds were able to outperform the S&P 500.
And it gets worse from there.
Over 10 years, only 8.5% outperform the S&P 500.
On top of the fact that there’s no guarantee, actively managed funds are expensive. We might see an expense ratio of around 1%. This means every $100 that we spend, we’re going to pay $1 in expenses every year.
This doesn’t sound like much, but over a long period of time, which if we’re investing properly for a long period of time, this will add up big time.
If we have a 1% expense ratio and an investment of $50,000 over 20 years with an average annualized return of 10%, we can expect to pay roughly $56,000 in fees.
If we compare that to our target expense ratio on passively managed funds of 0.1%, we’re only paying $6,000 in fees.
That’s a $50,000 difference which brings me to the third way that I can ensure that I only eat the tastiest blueberries.
Passively Managed Funds
I can use a filter.
This is analogous to an index fund or a passively managed fund.

Passively Managed Funds Illustration by Author
An index is just a set of criteria that companies must have in order to make the cut. The filter in this case that I’m going to analyze is the dividend growth filter. Companies that consistently grow their dividend exhibit resilience and steady growth.
Because passively managed funds use a simple filter, the process of picking companies can be largely automated. We don’t require a team of professionals, so the expense ratio will be much lower.
Typically, I shoot for an expense ratio of less than 0.1%.
Unfortunately, there are so many dividend oriented ETFs.
How could we narrow down the list? Would you use another filter? That’s exactly what I would do.
I use 3 criteria to determine which ETFs are going to outperform the market.
Criteria 1
The first ETF that fails my criteria is SPYD.
A lot of people love this ETF because it has a particularly high dividend at about 4.5%.
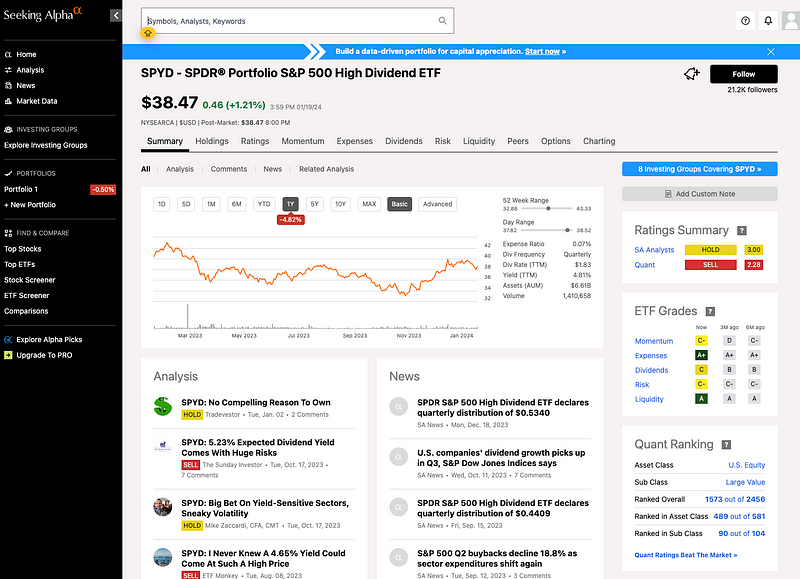
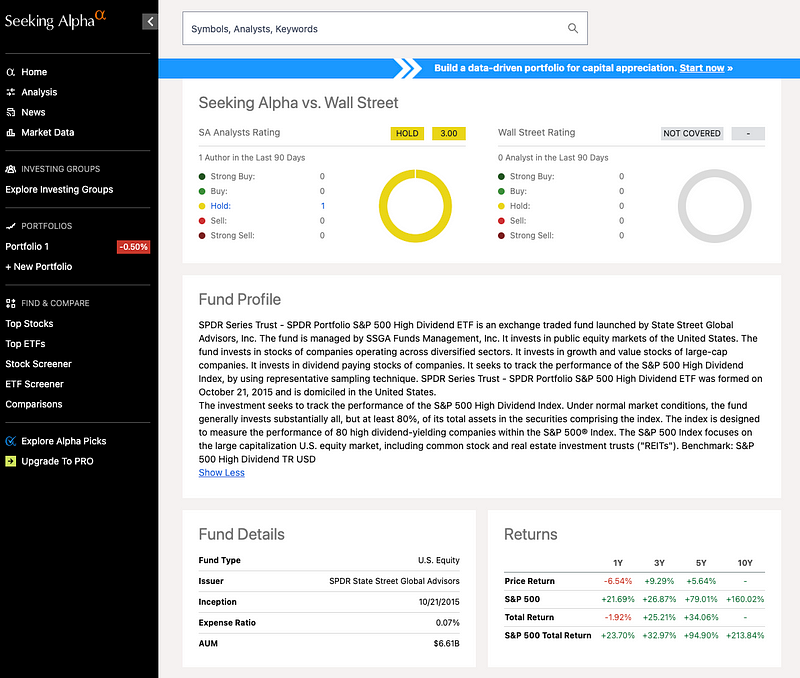
SPYD — SPDR Portfolio S&P 500 High Dividend ETF
On Seeking Alpha, under the Fund Profile section, we can see that SPYD seeks to track the performance of the S&P 500 High Dividend Index. Next, I can Google the criteria for the S&P 500 High Dividend Index and see what criteria it uses to pick companies to make it in its fund.
This index simply ranks all of the companies in the S&P 500 by dividend yield from the highest dividend yield at the top to the smallest dividend yield at the bottom.
Then it just picks the top 80 dividend yield companies.
SPYD — SPDR Portfolio S&P 500 High Dividend ETF
Does this sound like a good way to filter for high quality companies?
The first criteria that an index must have is quality. It must have a way of filtering for quality companies. In this case, it does the opposite.
Companies with an overly high dividend yield are not good. This is typically because they already have a high dividend and then the share price drops, resulting in the dividend yield going up.
Share price dropping is usually a bad sign for a company. And in a lot of cases, they will soon have to pause, cancel, or reduce their dividend.
SPYD fails my criteria of having a quality filter.
The next Dividend Growth ETF corrects the problem with SPYD as it tracks a very high quality index. However, it still falls short on my second criteria.
By the way, you’ll see in this video that I like to use Seeking Alpha for all of my investing research. If you’re interested in getting $50 off of a paid subscription, then you can use my affiliate link. Thanks for the support!
Criteria 2
KNGS is the Dividend Monarchs ETF.
On the Summary tab, we can go down to the Fund Profile and see that this investment seeks to track the total return of the S&P Dividend Monarchs Index.

KNGS — Roundhill S&P 500 Dividend Monarchs ETF
After Googling the index, we can see the eligibility factors for a company to be included in KNGS. It must have increased its total dividend every year for at least 50 consecutive years.
Any company that’s pulled this off is reliable and has had consistent growth. These are 2 qualities that we absolutely want to invest in when we’re talking dividend growth.
For a company not to pause, cancel, or reduce its dividend for 50 consecutive years shows that it’s incredibly reliable.
Not to mention, there have been several market crashes during that time period. Most recently we had the COVID-19 crash. Before that, we had the financial crisis of 2008. Before that we had the dot com bubble.

KNGS — Roundhill S&P 500 Dividend Monarchs ETF Fact Sheet
If I rely on my portfolio to cover my expenses, then having strong performance during a market crash is incredibly important.
How many companies are there that have managed to grow their dividend every year for 50 consecutive years?
The list is short.
KNGS only has 36 companies in its portfolio. This is not good for my second criteria.
Did you guess it?
Diversity.
It is incredibly important for my portfolio to be properly diversified. If my portfolio is not properly diversified, I could be overly exposed to one sector or one company.
For instance, during the financial crisis, if I was overly invested in real estate, my portfolio would have taken a huge hit.
It is incredibly difficult to be properly diversified with just 36 companies. I want to be exposed evenly to as many sectors of the U. S. economy as possible and as many companies as possible.

KNGS — Roundhill S&P 500 Dividend Monarchs ETF Fact Sheet
When we look at the sector breakdown of KNGS, we can see that consumer staples makes up over a quarter and industrials makes up about a fifth. Between just 2 sectors, that’s almost 50% of the total companies in my portfolio. Only 4 sectors make up 75% of the holdings, while all of the other sectors just make up 25%.
The next dividend growth ETF not only corrects the problem of diversification but also has a quality index that it tracks. However, it still fails on my third criteria.
Criteria 3
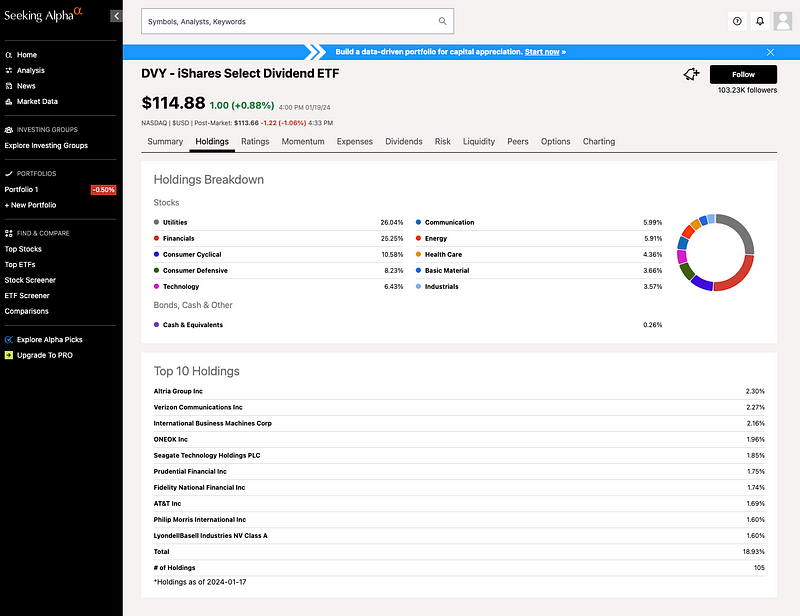
Ishare’s select dividend ETF ticker DVY has a solid yield at 3.84%.
On Seeking Alpha, in the Fund Profile section, we can see that it tracks the performance of the Dow Jones U.S. Select Dividend ETF.

DVY — iShares Select Dividend ETF
If we Google this index, we can once again see the criteria. DVY has many more quality controls than the Dividend Monarchs Index.
The dividend per share must be greater than the 5 year average dividend per share. This means it should be roughly increasing over the last 5 years.
It must have a very strong 5 year average dividend coverage ratio. This figure checks that a company’s profits are high enough to safely cover its dividend.
It must have paid dividends in each of the previous 5 years.
Each company must have a non-negative trailing 12 month earnings per share. I don’t know why they didn’t just say positive instead of non negative, but in any case, this just checks that a company has growing earnings.

DVY — iShares Select Dividend ETF
The next thing I want to verify is that DVY has more diversity of holdings than KNGS.
If we go to the Holdings tab on Seeking Alpha, DVY is currently invested in over 105 companies. This is 3X more than the Dividend Monarchs. However, the sector exposure is still roughly the same.
As you can see, utilities and financials together make up roughly 50% of the sector exposure. For better diversification, typically I like to see a more even spread on the holding breakdown.
DVY — iShares Select Dividend ETF
So DVY has a solid dividend yield, a good quality index that it tracks, and a decent diversification.
But where does it go wrong?
Past performance does not guarantee future returns.
On Seeking Alpha, if we go to the Charting tab, we can plot the total return over the last 10 years for both DVY and the S&P 500.
As you can see, the S&P 500 returned nearly 160%, while DVY returned only 133%.
The S&P 500 has 500 holdings and it has very good diversification.
If I’m going to invest in a dividend growth ETF whose goal is to invest more heavily in the top performers and find a way to filter out the bottom performers, then I need to see past performance that’s going to reflect that.
The final dividend growth ETF destroys the previous three in all three of my criteria.
Criteria 4: Cost
This ETF has a solid dividend yield of over 2% and it tracks the Dividend Aristocrats ETF.
The S&P 500 Dividend Aristocrats Index only allows companies that have increased their dividend every year for 25 consecutive years.
This isn’t as strong as the 50+ years from the Dividend Monarchs, but 25 years is still a lot. Companies in the Dividend Aristocrats still managed to survive the dot com bubble, the financial crisis of 2008, and the COVID-19 crash of 2020.

NOBL — ProShares S&P 500 Dividend Aristocrats ETF
Why is the Dividend Aristocrats better than the Dividend Monarchs?
Well, it’s a little bit easier to meet the criteria of 25 consecutive years. As a result, more companies can be invested.
More companies means greater diversification.
In the Holdings tab on Seeking Alpha shows that this ETF has a similar sector breakdown, but nearly double the number of holdings at 69.

NOBL — ProShares S&P 500 Dividend Aristocrats ETF
The final criteria to check on this ETF is the past performance.
The charting tab on Seeking Alpha shows that the ProShares S&P 500 Dividend Aristocrats ETF, ticker NOBL, has outperformed the S&P 500 over the last 10 years, returning 167%, while the S&P 500 returns about 160%.

NOBL — ProShares S&P 500 Dividend Aristocrats ETF
At this point, you must have noticed that NOBL has many good qualities, but it comes at a high price. It’s expense ratio is much higher than the average passively managed fund.
If you were like me, then you still wouldn’t be satisfied with this hefty fee.
In fact, I refuse.
So I spent 34 hours researching index fund criteria, holdings analysis, checking expense ratios, and analyzing past performance.
As a result, I found 3 dividend growth ETFs that destroy the Dividend Aristocrats for less cost, and I’m sharing all about it right HERE.
Catch you on the flip side.
Reply