- The Moneycessity Newsletter
- Posts
- How to Pick DIVIDEND GROWTH ETFs (Better than S&P 500)
How to Pick DIVIDEND GROWTH ETFs (Better than S&P 500)
We will look at the best dividend growth ETFs over the past 10 years, discuss why investors should care about dividend growth investing strategy, the factors to consider when investing in ETFs, and how to use research key metrics such as expense ratios, diversity, and past performance to determine high-performing dividend growth ETFs.
Brian Glass
January 27, 2024
Do you know what it takes to beat the S&P 500?
I have spent 34 hours comparing more than 50 dividend growth ETFs, and I have narrowed down the list to the top 3 that have outperformed the S&P 500 over the last 10 years.
Picking individual companies takes a lot of time and expertise, especially if you want to own enough companies to call your portfolio diversified. Investing in a quality dividend growth ETF will solve this issue.
On the go? Watch the video HERE.
Before I get into the top three, let me ask you this.
Why Should You Care About the Dividend Growth Investing?
There is an important distinction between investing for dividend yield and dividend growth.
Dividend Yield Investing
When you’re just looking to maximize dividend yield, you tend to pick companies that have a very high dividend compared to their price.
Well, sometimes there’s a good reason that the price is low, and it could be that this company isn’t going to be able to afford their dividend going into the future.
Dividend Growth Investing
When you are investing for dividend growth, you’re trying to maximize for quality companies that have a strong track record of consistently paying their dividend and growing their dividend.
When executed correctly, investing for dividend growth gives you three things:
First, it gives you a reliable stream of passive income in the form of dividends. Who doesn’t like passive income?
Second, having that reliable stream of passive income allows you to not have to sell as many shares. Not having to sell shares to get income is really good for your investor psychology.

Actively Managed Funds Statistics According to Forbes
In general, investors who make more transactions tend to perform worse than investors that make fewer transactions. This even holds true for the professionals.
Over the course of the last year, 51% of actively managed mutual funds underperformed the S&P 500 and 49% of actively managed funds outperformed the S&P 500. However, those numbers get even worse if you look at longer investment periods.
Over 5 years, only 13.5% of actively managed funds did better, and over 10 years that number drops down to 8.5%. Statistically speaking, investors who make more transactions tend to perform worse than investors that just buy and hold.
3. The third thing you’ll get is greater returns than the broader market. But why do these ETFs perform so well?

Why Dividend Growth is a Timeless Strategy
You can think of dividend growth as a filter that you put on the greater market. You have all of these companies and the ones that do have consistent dividend growth make it past the filter and the ones that don’t, you don’t invest in.
Consistent dividend growth acts as a proxy for several positive qualities that a company can have. A company with consistent dividend growth is resilient and has consistent growth. The dividend also signals future profit and future cash flow growth.
What Should You Look For in Dividend Growth ETF?
The example I want to use as the quintessential dividend growth ETF is the Dividend Aristocrats ticker NOBL.
NOBL has a solid dividend yield of over 2%.
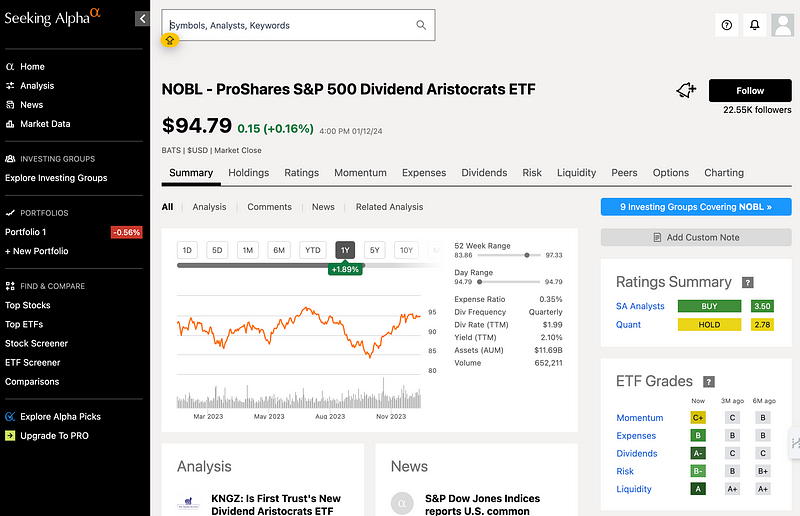
1. Index Tracking
The next thing I want to look at is what index it’s tracking. In this case, the index is like the filter that NOBL uses to determine which companies are going to make the cut for it to invest in.
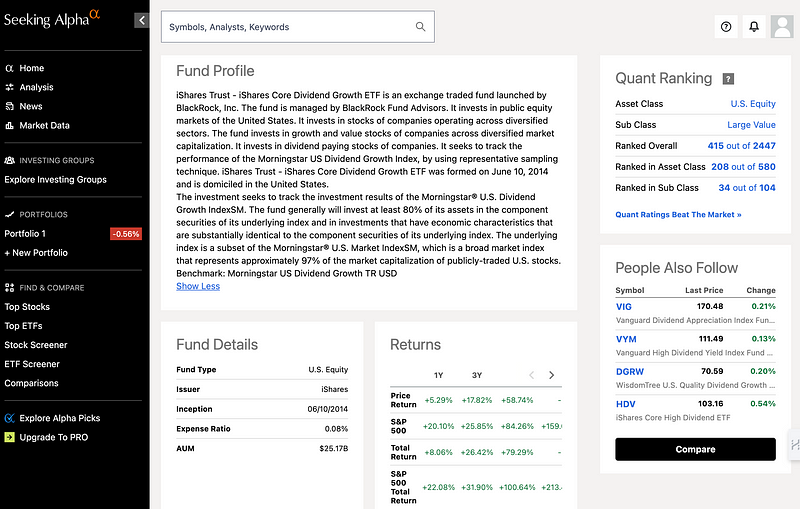
I like to use Seeking Alpha to research different ETFs. The way you can see which index NOBL is tracking is by going to the Fund Profile section. Here we can see that this ETF seeks to track the performance of the S&P 500 Dividend Aristocrats Index.

After a quick Google search, I can see the eligibility criteria for the S&P 500 Dividend Aristocrats Index.
We can see that in order to qualify, a company must have increased its total dividend amount every year for at least 25 years. If a company can match this criteria, then clearly it is a consistent dividend growth company.
2. Diversity
The next criteria that I like to look at is the diversity. You can see this on Seeking Alpha by going to the Holdings tab.

Here you can see that NOBL currently has 69 different companies that it is invested in. The top holding consisting of only 1.75% of its total, which is pretty small. NOBL has exposure to all the major sectors of the economy. However, it does have a little bit of a high exposure to consumer defensive and industrials making up about 46% of its total exposure.
3. Past Performance
The next criteria that I like to consider is the past performance. How does it compare to the S&P 500 over the last 10 years?
Once again, on Seeking Alpha, you can go to the Charting tab and you can compare up to 7 different stock tickers. When I look at NOBL and the S&P 500, you can see that over a 10 year period, the S&P 500 saw 155% growth, while NOBL saw 163% growth.

The Dividend Aristocrats has everything, but it still doesn’t make my top three. What kind of ETFs could possibly top NOBL? Well, you may have noticed that NOBL has many good qualities, but it comes at a high price.
4. Cost
If we take a look at the expense ratio, NOBL costs you 0.35% per year to hold this fund.
Let’s say a single share is $100. This means you’re going to spend 35 cents to hold that share for one year. This doesn’t seem like a lot, but it adds up over time.
Using this investment calculator, we can see how much you would have to pay in fees on a $50,000 investment over a 20 year period.
Assuming average annual returns of about 10%, a 0.35% fee means you’re paying over $20,000 over the term of 20 years. Compare this to the average passively managed ETF ‘s fee of 0.06%, you’re only paying about $3,657 over 20 years. That is nearly a $17,000 difference.
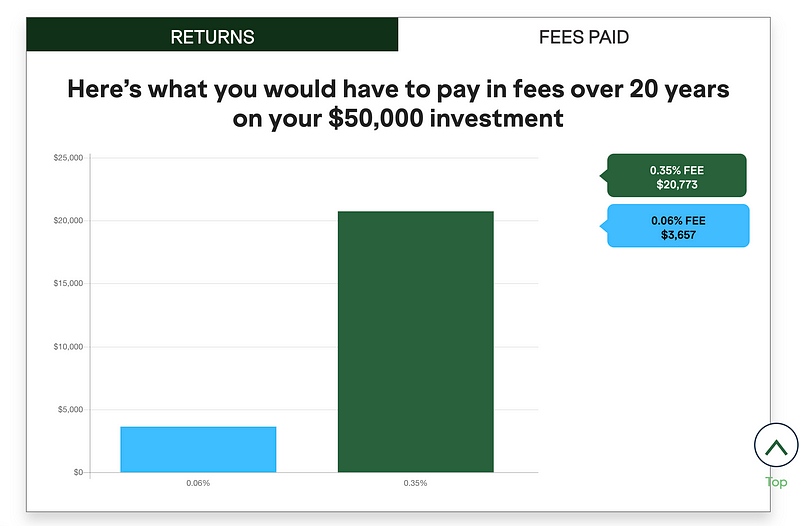
Investment Returns Accounting for Management Fee Calculations done by author
As you can see, it is definitely worth it to seek out a lower fee.
This brings me to the third place ETF on my top three, which destroys NOBL in every way. On top of that, it does it cheaper.
My 3rd Ranked Dividend Growth ETF
This ETF has an expense ratio of just 0.06%. Additionally, it has superior diversity.

On the holding tabs of this ETF, you can see that it has 317 different companies, way more than NOBL. This ETF also has a better spread on sector exposure: 23.5% on technology, 18.5% on financials, 15% on healthcare, 12% on industrials, and 11% on consumer defensive.

The ETF we’re looking at is VIG, Vanguard Dividend Appreciation Index Fund ETF.
The next criteria I want to look at is which index fund is it tracking? On the fund profile, we can see that VIG seeks to track the performance of the S&P U.S. Dividend Growers Index.
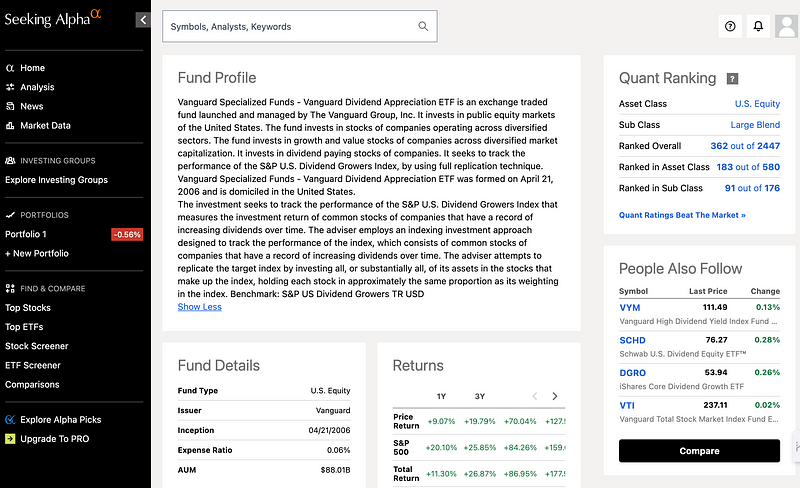
Once again, we can Google the eligibility criteria of this index and we can see that the U.S. Dividend Growers requires companies to have 10 years of dividend growth as opposed to 25 on the Dividend Aristocrats.
One extra criteria that VIG has that the Dividend Aristocrats do not is it filters out the top 25% companies with the highest dividend yield.
This seems a little bit counterintuitive at first. Wouldn’t you want companies that pay a higher dividend yield? Well, not necessarily.
Companies that have a really high dividend yield are more likely to fail to pay their dividend in the future. By implementing this additional criteria, VIG is able to remove companies from consideration that might pause, reduce, or cancel their dividend in the future.
The final criteria I want to look at is past performance. How does VIG stack up against the Dividend Aristocrats over the last 10 years?

By going to the charting section, we can see over the last 10 years, VIG had a return of 175%, while the Dividend Aristocrats returned 163%, and in third place, the S&P 500 with 154.5%.
As you can see, VIG crushes NOBL in every metric that matters, but it is still just third on my list.
By the way, you’ll see in this video, I like to use Seeking Alpha for all of my investing research. If you’re interested in getting $50 off of the paid subscription, then you can use my affiliate link HERE.
My 2nd Ranked Dividend Growth ETF
The next ETF I want to look at has an even higher dividend yield than VIG, nearly 2.5%. This next ETF also has superior diversity.

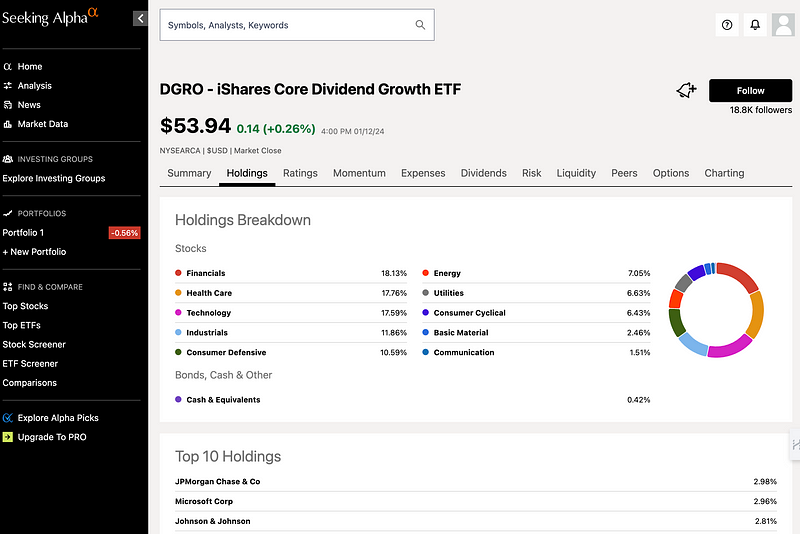
By going to the holdings tab, we can see this ETF has 424 companies and it has a better breakdown of sector exposure. The highest exposure being financials at 18%. When we compare this to VIG, the the top exposure was technology at 23.5%.
In general, you want to see roughly equivalent exposure to all the sectors, if possible. There’s not going to be an ETF out there that has exactly 10% exposure to all of them, but the closer you can get the better.
The ETF we’re looking at is DGRO, iShares Core Dividend Growth ETF.
DGRO seeks to track the performance of the Morningstar U.S. Dividend Growth Index. This index implements a few more quality controls that I really like to see. Similar to VIG, this ETF is also eliminating the top 10% portion of companies by dividend yield compared to 25% by VIG.
On top of filtering out high yield dividend companies, there must also be a positive consensus on earnings forecast, and every company must have a payout ratio of less than 75%.
The payout ratio refers to the amount of profits a company has compared to how much of a dividend they pay out. This means that the dividend cannot exceed 75% of the company’s profits.
A lower payout ratio just means that a company is having an easier time affording its dividend. Hypothetically, if a company had a 100% payout ratio, that would mean that it’s taking 100% of its profits and paying it out in the form of a dividend. This doesn’t leave very much wiggle room.
And finally, this ETF requires at least 5 consecutive years of dividend growth.
I like the index that DGRO is tracking more than VIG because of the additional quality controls that companies have to pass in order to make the cut.

Past performance does not guarantee future performance, but it is a good indicator. And DGRO has the best out of all of them.
Now, a quick note, this isn’t 10 years of past performance, this is about 9.5 years because DGRO was initiated 9.5 years ago. So I can’t do a full 10 years of performance, but 9.5 is close enough.
You cannot go wrong investing in DGRO but it does get destroyed in every metric by my number one dividend growth ETF.
My 1st Ranked Dividend Growth ETF
The number one dividend growth ETF on my list has the highest dividend yield that we’ve seen so far of nearly 3.5%.
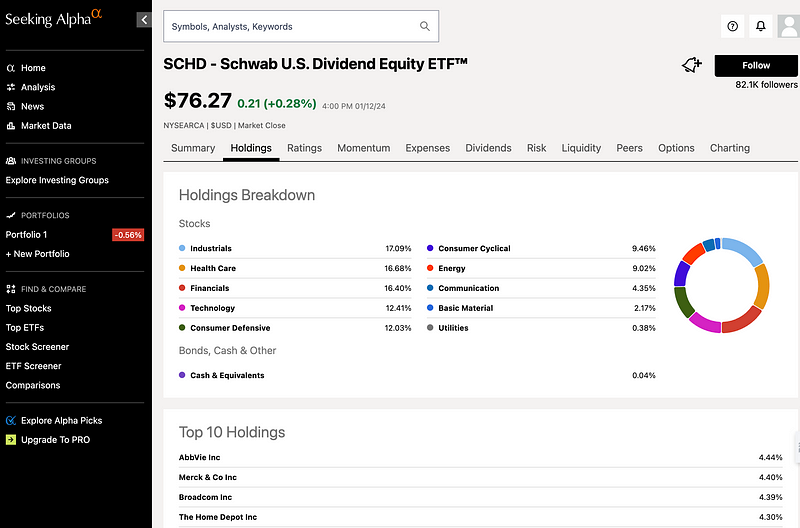
The diversity is really strong with this ETF even though it has a lower number of holdings than the previous two we looked at, 104 companies. The sector breakdown is much more even and has more equal exposure to all of the sectors.
The ETF we’re looking at is Schwab U.S. Dividend Equity ETF, ticker SCHD.

This ETF seeks to track the performance of the Dow Jones U.S. Dividend 100 Index. This index has additional quality controls that are superior to even the DGRO. The Dividend 100 Index requires that a company have a minimum of 10 consecutive years of dividend payments while DGRO accepted companies that have a minimum of 5 consecutive years of dividend growth.
Additionally, this index ranks 4 additional fundamental based characteristics: free cash flow to total debt, return on equity, dividend yield, and five year dividend growth. The 4 rankings are equally weighted and create a composite score.
By tracking a superior index, you would assume that it would have superior past performance and you would be correct.

If we look at the charting section of Seeking Alpha, you can see that SCHD has the best past performance over the last 10 years with a return of 171%, just barely edging out DGRO.
Even though we have gone back 10 years in our analysis of the past performance of these ETFs, we’ve really only captured one major stock market crash during that time, COVID-19. This particular crash was atypical in that it was over very quickly. The S&P 500 was back to all time highs in just a few months.

S&P 500 Performance Over COVID-19 Crash
If you’re depending on your portfolio to cover your living expenses, then it is super important to consider recession performance of your holdings. Check HERE to see the top performing ETFs during an economic recession.
Until next time.
Reply